What information does a deep gesture-recognition model extract from EMG, and how does that information relate to familiar handcrafted features? This study examined the network’s internal representations instead of treating recognition accuracy as its only useful output.
We combined feature-space mapping, input visualizations, feature regression, and classification probes. Handcrafted features acted as interpretable reference points, helping describe where the learned representation resembled established signal summaries and where it differed.
The question
A handcrafted feature has a stated operation: summarize amplitude, count waveform changes, or describe frequency content. A learned feature is defined by trained weights, so its role is less obvious.
The question was not simply whether learned features were better. It was whether their information could be characterized, whether it changed through the network, and whether comparisons with known features could make the model’s decisions easier to interpret.
The study at a glance
- Data
- The 3DC dataset: 22 intact-limbed participants, ten hand/wrist gestures plus neutral.
- Recordings
- Ten EMG channels sampled at 1,000 Hz; 151 ms windows.
- Model
- A six-block convolutional network, trained with adaptive domain-adversarial neural network training (ADANN).
- Interpretation tools
- Mapper feature networks, Guided Grad-CAM, single-feature classifiers, and handcrafted-feature regression.
How we approached it
ADANN combined gesture learning with a penalty discouraging participant-specific representations. Participant-specific batch-normalization statistics were retained. This training procedure provided a more useful shared model for the subsequent interpretation analyses.
Mapper grouped features with similar patterns across the recordings. Adding handcrafted features to the same analysis provided reference points for the learned features. Separate regression analyses asked whether information about a handcrafted feature could be reconstructed from each network block, even without a close one-to-one counterpart.
Guided Grad-CAM highlighted portions of an input associated with a class prediction. Finally, LDA classifiers using individual learned features or entire feature groups helped distinguish a feature that broadly separates gestures from one that mostly detects a particular class.
Technical detail: the evaluation
The dataset contained four acquisition cycles for training and four additional cycles after a five-minute break for testing. Validation and hyperparameter choices came from training data. The shared-model results should not be interpreted as calibration-free performance on a completely unobserved population.
Mapper edges indicate overlapping membership between feature groups. Spatial distance on the plotted page is not a calibrated measure of physiological similarity. Regression and classification probes provide complementary evidence because a network can encode information across several features.
What we found
The ADANN model achieved 84.43% mean test accuracy, compared with 65.03% for conventional training. That difference establishes why the adapted representation was useful to study; the paper’s main interpretive contribution comes from examining what the representation contained.
Learned features clustered partly by network depth. Earlier blocks contained information related to general signal properties, whereas later features increasingly acted like one-versus-all gesture detectors. A feature specialized for one gesture may perform poorly as a complete multiclass recognizer on its own while contributing strongly to the full representation.
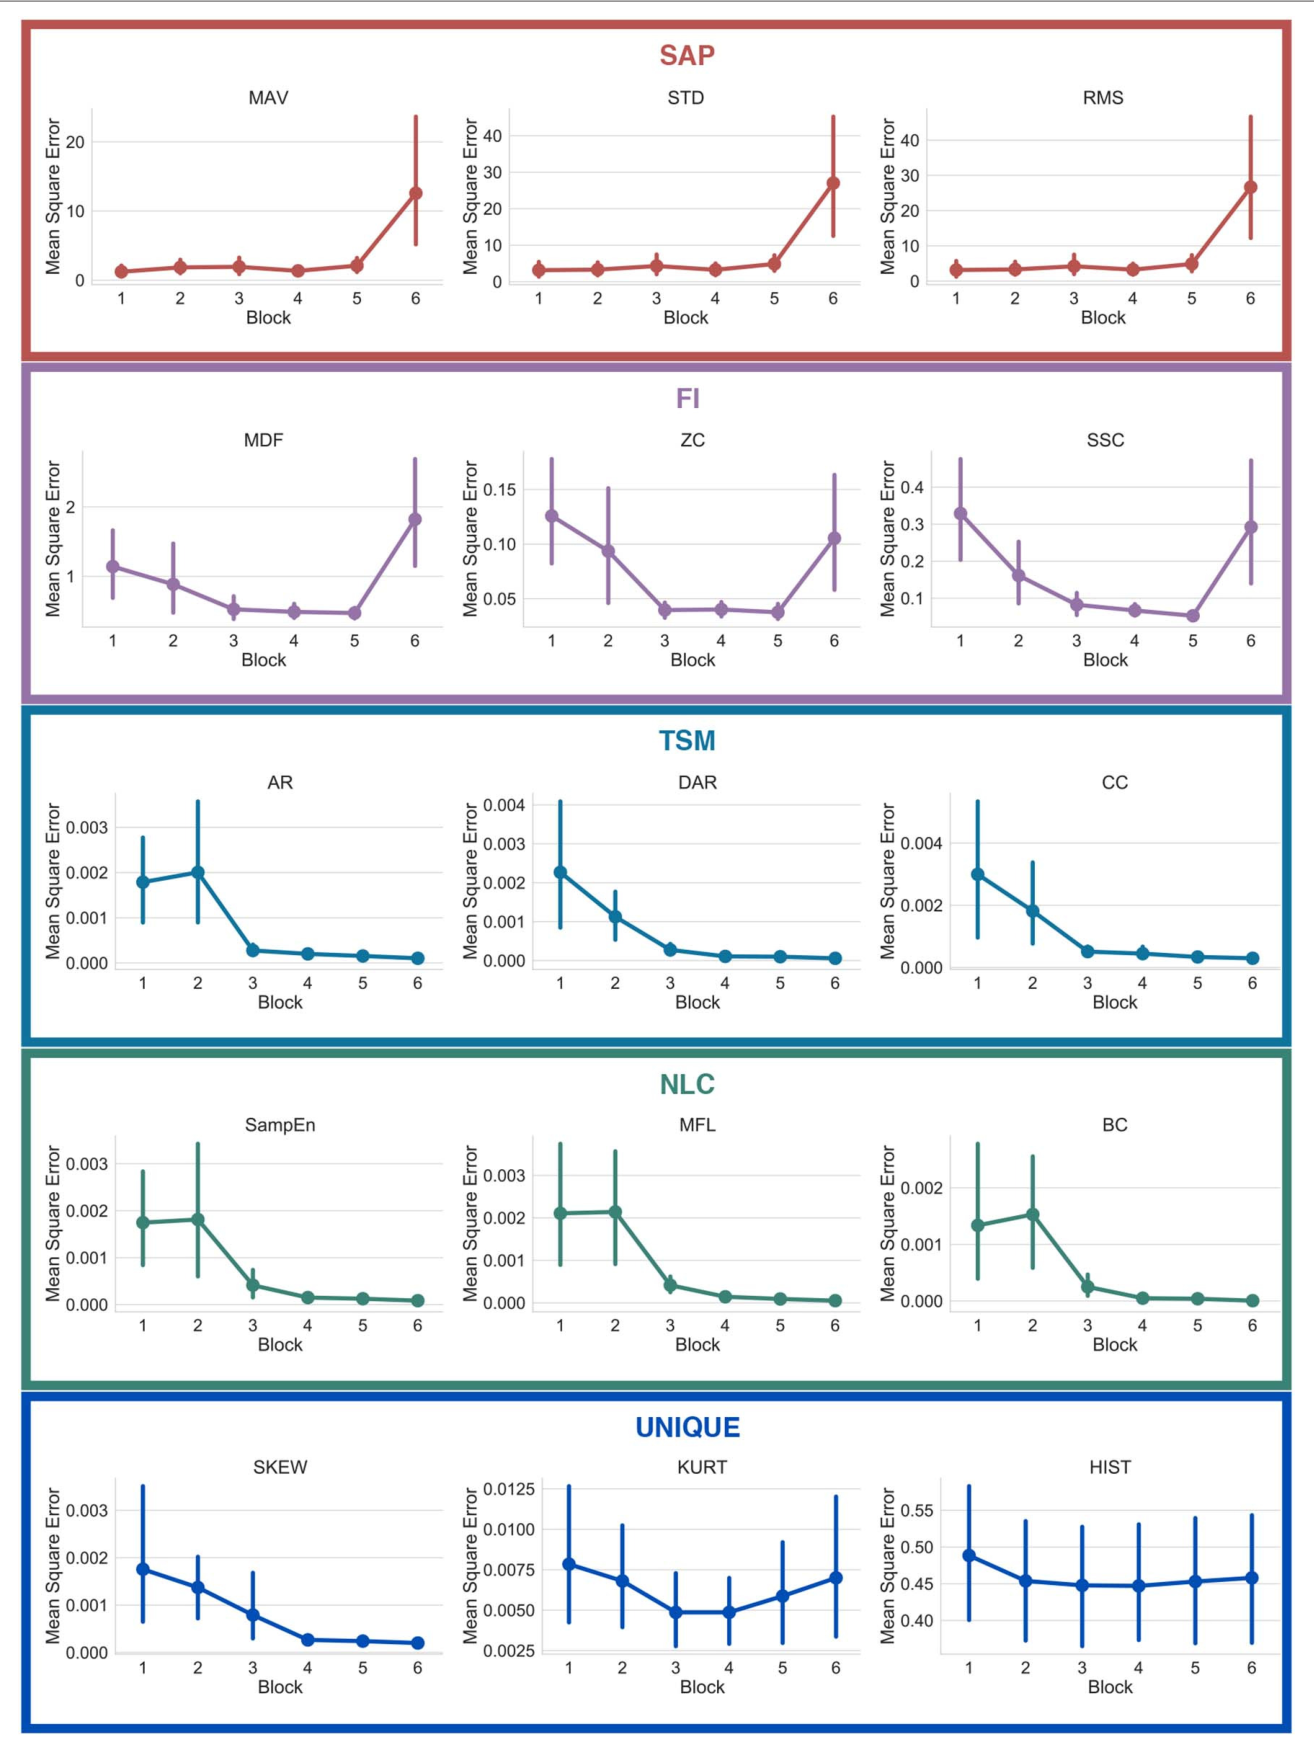
Frequency-related handcrafted features lacked direct shared Mapper nodes with learned features, yet regression could recover frequency information from intermediate blocks. Absence of an obvious one-to-one feature match therefore did not establish absence of that information.
The input visualizations also showed cases where the most active channel was not the most influential for the prediction. This concerns the examined model and examples; it does not establish a general rule for electrode placement.
Reading the figures
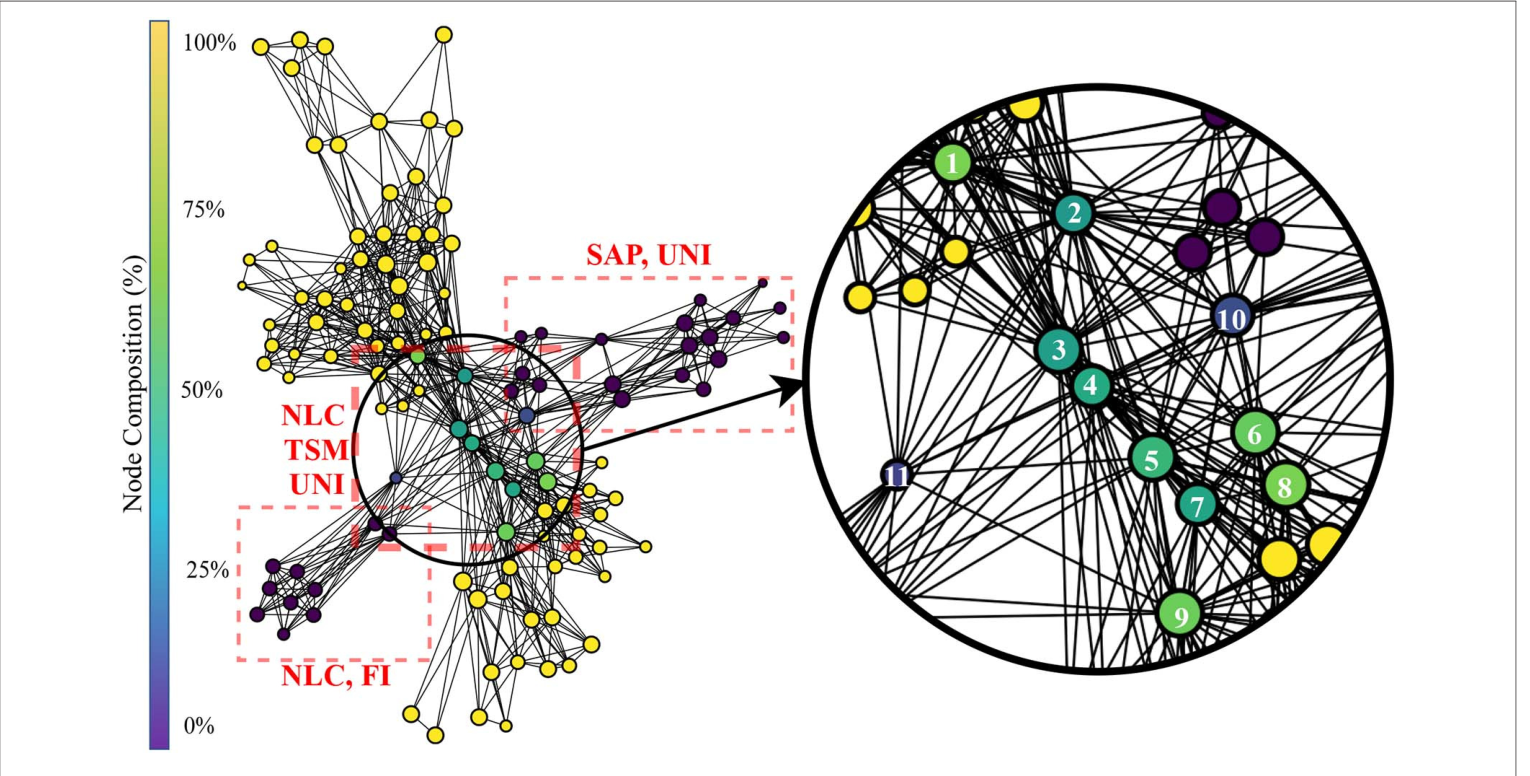
The colour scale describes the composition of each node, and the connecting lines indicate shared feature membership. The magnified region makes mixed and neighbouring groups easier to inspect.
Use the network to look for relationships between feature families and learned representations. A blank connection is not proof that the model lacks a type of information: the regression analysis specifically tests information that may be distributed across multiple features.
The regression analysis asks what information remains recoverable from each depth of the network. Each small plot predicts a handcrafted feature from learned features; lower error means better recovery for that particular target. Compare depth within a panel rather than raw errors across differently scaled features. This provides a complementary check to the topological maps: a weak map connection alone does not establish that the information has disappeared.
What the results do not establish
The findings describe this architecture, training procedure, and dataset. Different inputs, objectives, or network structures could organize their representations differently.
Saliency maps and feature-space projections are interpretive tools, not causal demonstrations. Establishing that a channel or feature is necessary would require an intervention, such as a carefully controlled ablation, followed by an appropriate evaluation.
Looking back
The strongest retrospective value is the combination of several probes of the same representation. The apparent absence of a frequency-feature counterpart becomes more informative when compared with the regression results, rather than being treated as a complete explanation on its own.
A focused extension would repeat the probes across architectures and training runs, then test selected interpretations with channel or feature interventions. That would examine which observations are stable properties of EMG representations and which belong to this particular model.
Read further
Ulysse Côté-Allard, Evan Campbell, Angkoon Phinyomark, François Laviolette, Benoit Gosselin, and Erik Scheme. Interpreting Deep Learning Features for Myoelectric Control: A Comparison With Handcrafted Features. Frontiers in Bioengineering and Biotechnology 8, 158, March 3, 2020. DOI: 10.3389/fbioe.2020.00158.
Figures 8–12 contain the complementary visualizations and probes; Table 3 separates single-feature from group classification. Côté-Allard and Campbell contributed equally.