How different are myoelectric patterns from one person to another, and does that variability differ between people with intact limbs and people with limb loss? This study used several complementary analyses to characterize those differences in a group of 30 participants.
In this preliminary study, we asked how electromyography (EMG) patterns varied across participants with and without limb loss. The question was motivated by cross-user myoelectric control: using existing recordings to reduce the amount of training required from a new person.
The question
Within-user gesture recognition asks whether a model can recognize a new repetition from someone whose movements it has already seen. Cross-user recognition asks whether it can work for another person. The latter is attractive because repeated calibration can be burdensome, but it also exposes anatomical and behavioural differences that a single-user experiment can avoid.
We asked whether participants formed homogeneous subgroups based on their EMG patterns, whether those groups corresponded to limb status, and how much variation remained within each population. These questions concern the observed signal patterns; explaining their physiological causes would require additional measurements.
The study compared participants’ overall signal patterns, visualized their relationships, and asked whether a simple classifier could distinguish which population a held-out participant belonged to. That last task is a probe of population differences, not the intended application of controlling a prosthesis.
The study at a glance
- Data
- NinaPro databases 3 and 7: 20 participants with intact limbs and ten with transradial limb loss.
- Shared movements
- 38 motions common to the databases, each repeated six times. Recordings used 12 EMG electrodes sampled at 2,000 Hz.
- Representation
- Four Hudgins time-domain features, extracted from 200 ms windows advanced every 100 ms.
- Three analyses
- Hierarchical clustering, principal component visualization, and linear discriminant analysis of gestures or participant group.
The distinction between 38 and six movements is important. The overall-pattern analysis used the 38 common motions. The conventional gesture-recognition comparison used six clinically relevant movements: wrist flexion and extension, pronation and supination, power grip, and pinch grip.
How we approached it
We first represented the EMG using mean absolute value, waveform length, zero crossings, and slope sign changes. These features summarize amplitude and aspects of signal variation. Using a familiar, relatively simple feature set helped make the analysis about the structure of the recorded patterns rather than the capacity of a large model.
Hierarchical clustering then grouped participants with similar overall patterns. Ward’s method builds a tree by merging the pair of groups that produces the smallest increase in within-group variance. Cutting that tree at different levels provides a view of broad divisions and finer subgroups, without using the participant-group labels to construct the clusters.
Principal component analysis (PCA) provided a complementary visualization. It projects the data onto directions that explain large amounts of variation. We also used linear discriminant analysis (LDA) for two different purposes: recognizing gestures within a participant and classifying a held-out participant’s population from their signal patterns.
Technical detail: the three classification results answer different questions
Within-subject gesture recognition used leave-one-repetition-out cross-validation on six motions. Population classification instead used leave-one-subject-out cross-validation, combining information across motions and repetitions into overall patterns.
The population-classification task was also repeated using individual 200 ms windows. This tests how much evidence is available in one brief observation, rather than in a participant’s aggregate pattern. The same population label does not make these two input representations equivalent.
There were twice as many intact-limbed participants as participants with limb loss. The paper therefore reports a 66% chance reference for the window-level population task. A score near that reference should not be interpreted as strong discrimination simply because it exceeds 50%. Source: Sections 3–4.
What we found
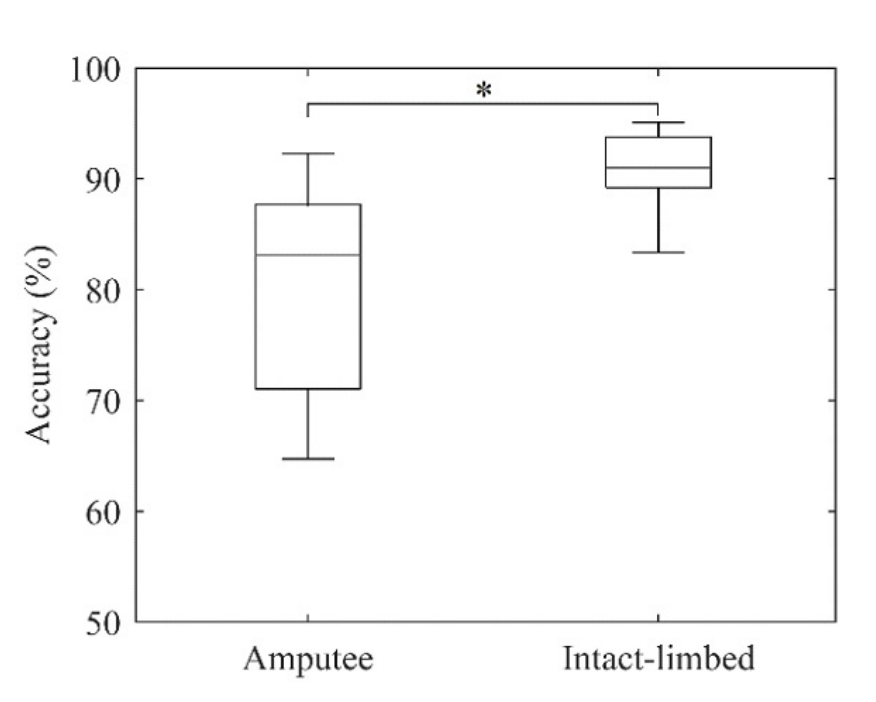
The conventional within-user gesture comparison reproduced a familiar gap. Mean accuracy was 90.54% for the intact-limbed group and 80.58% for the limb-loss group, with reported standard deviations of 3.6% and 9.8%, respectively. The difference was significant at p < 0.01. The larger spread in the limb-loss group also showed why a single pooled mean is incomplete.
At the two-cluster cut of the hierarchical tree, the groups separated exactly by participant population. At the six-cluster cut, the intact-limbed group split into two subgroups and the limb-loss group into four. This was evidence of structure in the recorded patterns, and suggested greater heterogeneity within the latter group under this representation.
| Task | Evaluation | Reported accuracy |
|---|---|---|
| Six gestures, intact-limbed participants | Within user; held-out repetition | 90.54% ± 3.6% |
| Six gestures, participants with limb loss | Within user; held-out repetition | 80.58% ± 9.8% |
| Participant population from overall patterns | Held-out participant | 90% |
| Participant population from one window | Held-out participant; 200 ms input | 66% mean; paper’s chance reference 66% |
Sources: Figure 1 and Sections 3–4 of the March 2020 manuscript. The first two spreads are standard deviations. The 90% population result is not cross-user gesture-recognition accuracy.
The contrast between overall patterns and single windows is particularly informative. LDA could identify the population of a held-out participant with 90% accuracy using aggregate patterns, while the short-window version averaged 66%. Population structure became visible through a richer summary of behaviour; it was not equally identifiable from every brief recording.
The first three principal components explained 54% of the variance and showed a similar broad separation. That agreement between visualization, clustering, and classification strengthened the descriptive result, while still leaving open why those differences occurred.
Reading the figures
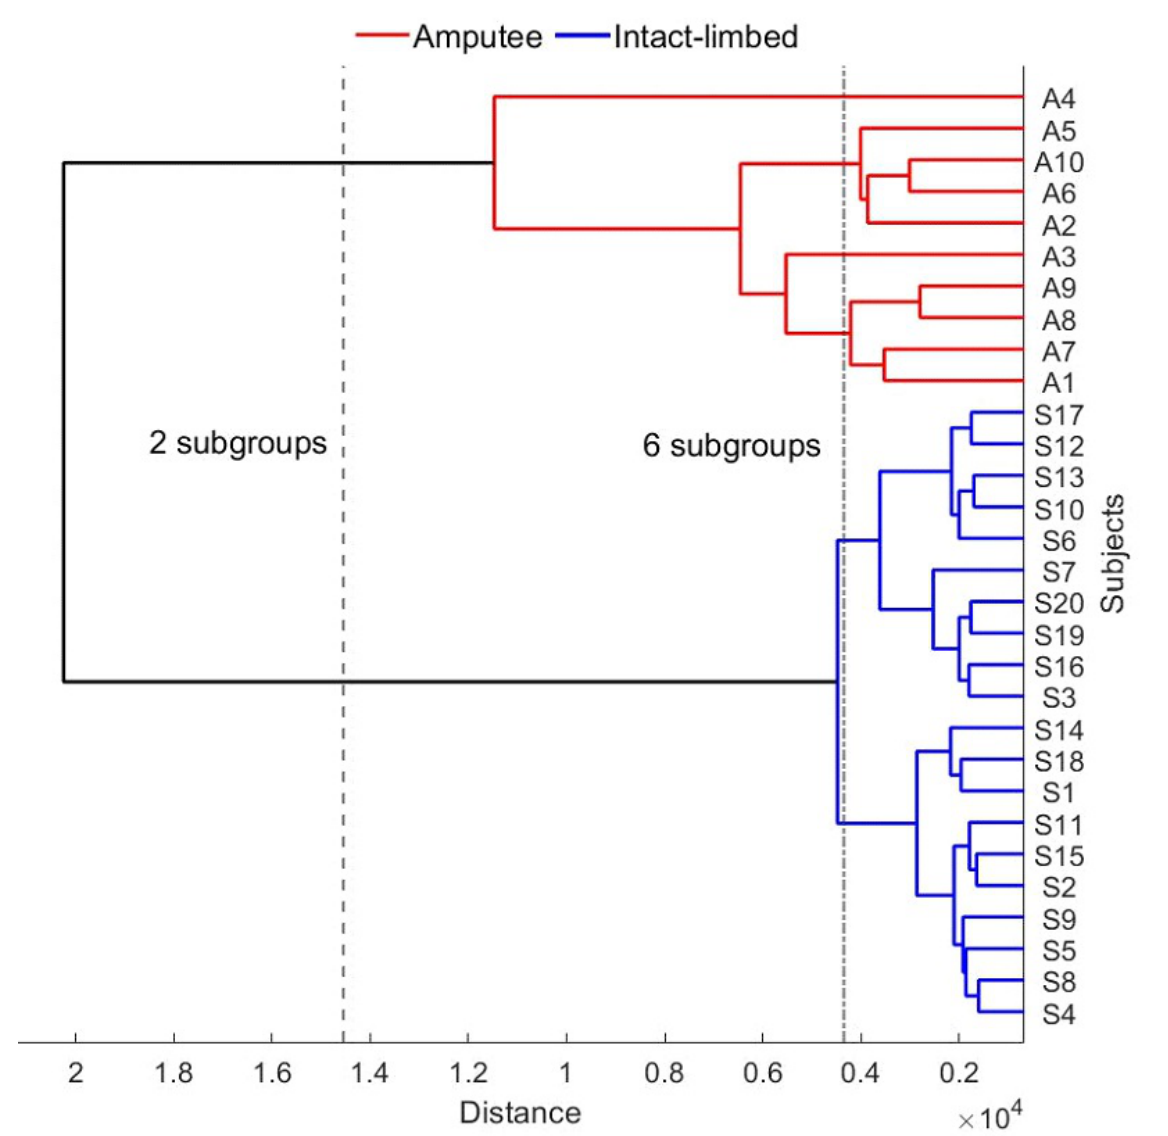
Start at the participant labels on the right. Each branch joins that participant to the most similar available group under the clustering rule. The horizontal distance records how far apart groups were when they merged. Colours identify the participant populations for interpretation; those labels were not the input used to build the hierarchy.
The two vertical dashed lines show the chosen cuts. The broader cut produces one group for each population. Moving to the six-group cut reveals four limb-loss subgroups and two intact-limbed subgroups. The result should be read as a property of this dataset and distance measure, rather than a claim that people naturally fall into exactly six biological categories.
This result complements the clustering view with the spread in gesture-recognition accuracy across individuals. The limb-loss group has a wider distribution in these recordings. It helps quantify inter-subject variability in task performance; it should not be read as a physiological explanation for the difference or as a prediction for every individual.
What the results do not establish
The study combines two existing databases. Although it restricts analysis to common motions and uses a consistent feature representation, population membership is entangled with database membership for many participants. Collection conditions, electrode placement, and protocol details may contribute to the observed separation. A matched collection would be needed to isolate those contributions more convincingly.
The limb-loss group contains ten people with varied clinical histories. Some exploratory subgroup observations were discussed, but the sample is too small to establish reliable clinical categories or explain the clusters through a particular anatomical factor. Their purpose is to motivate investigation, not diagnose an individual from EMG.
Clustering, projected variance, and classification accuracy describe different aspects of inter-subject differences. None is a universal physiological measure of variability. The reported grouping also depends on the selected features, aggregation across gestures, and clustering distance; its stability under other representations was not established.
Looking back
Viewed retrospectively, the study characterizes inter-subject variability at several levels. The dendrogram describes participant similarity, PCA shows major directions of variation, and the classifiers quantify how distinguishable gestures or participant populations are under specified inputs. Their agreement supports a difference between the two groups in these recordings, while the finer clusters describe substantial variation within the limb-loss group.
The contrast between aggregate and single-window population classification further locates that difference. It was clearer when observations were combined across movements than in one brief EMG segment. This helps specify the scale at which the study detected inter-subject structure, rather than suggesting that every recording from one group is readily distinguishable from the other.
A focused follow-up would repeat the analysis with matched acquisition conditions and more participants, quantify within- and between-group distances with uncertainty intervals, and test whether subgroup assignments persist across recording sessions and feature choices. Relating those distances to measured clinical or anatomical variables could then investigate their origins. These are proposed extensions of the variability analysis, not explanations established by the original paper.
Read further
Campbell, E., Chang, J., Phinyomark, A., and Scheme, E. (2020). A Comparison of Amputee and Able-Bodied Inter-Subject Variability in Myoelectric Control. Myoelectric Controls Symposium. DOI: 10.57922/mec.45. The March 2020 manuscript is also available as arXiv:2003.03481.
Open the published MEC20 paper and PDF or the arXiv manuscript. Read Section 3 before comparing the accuracies in Sections 4–5; Figures 2–3 explain the participant-level structure.