Recognizing a gesture at one arm position and effort level does not establish that it will remain recognizable at another. This paper examines how much those two changes affect myoelectric pattern recognition, and which training choices help.
We combined a literature review with a systematic analysis of six existing datasets. The objective was to characterize limb-position and contraction-intensity effects, compare proposed responses, and make training recommendations grounded in the tested conditions.
The question
An EMG classifier can learn distinctions between hand gestures while also depending on the posture or effort used to demonstrate them. Moving the forearm changes the relationship between muscles and electrodes; changing contraction intensity changes the recorded activation patterns. A same-condition test does not measure either sensitivity.
The study therefore asked separate questions: what happens when training and testing conditions match, what happens when they differ, and how much is recovered by including several conditions during training? Distinguishing these questions is essential to interpreting the reported accuracies.
The study at a glance
- Evidence
- Literature review plus six existing datasets from intact-limbed participants.
- Position conditions
- Five arm positions, sixteen arm positions, and three forearm orientations in separate datasets.
- Intensity conditions
- Seven prescribed levels from 20% to 80% of maximum voluntary contraction, plus two datasets with three subjective effort levels.
- Recognition pipelines
- Five feature sets and five classifiers; 150 ms windows advanced every 50 ms.
How we approached it
We evaluated each participant separately and held out repetitions when testing recognition. The comparisons separated matching-condition performance from performance on other conditions. Additional analyses expanded the set of positions or effort levels supplied during training.
The feature sets summarized different aspects of amplitude and signal variation. The classifiers included linear discriminant analysis (LDA), nearest neighbours, quadratic discriminant analysis, random forests, and a linear support vector machine. Comparing these combinations helped distinguish sensitivity to the experimental factor from sensitivity to a particular pipeline.
Technical detail: the evaluation
The paper calls its comparisons x-versus-x, x-versus-y, x-versus-all, and N-versus-all: train and test in one matching condition; train in one and test another; train in one and test all; or train in several and test all. These are within-participant evaluations, not tests on previously unseen people.
The six datasets differ in hardware, gestures, and protocol. They should not be treated as one pooled cohort or as a controlled head-to-head comparison of every acquisition choice.
What we found
With the conventional time-domain features and LDA, the five-position dataset achieved 94.5% mean accuracy within a position and 80.2% across positions. For the three-orientation dataset, the corresponding values were 96.1% and 36.8%. Both show sensitivity, but the markedly different losses argue against assigning one universal penalty to “position.”
For seven prescribed effort levels, the same pipeline achieved 94.0% within an intensity and 67.9% across intensities. These Table 6 values concern gesture classification under the study’s intensity protocol; they are not errors in estimating force.
Including several conditions improved coverage. The analyses supported four positions in the five-position dataset, six in the sixteen-position dataset, and all three tested forearm orientations. For intensity, low and high examples were useful together; the prescribed-force analysis favoured 20% and 70% of maximum voluntary contraction. These are recommendations from the tested conditions, not a claim that the same minimum works for every device.
Reading the figures
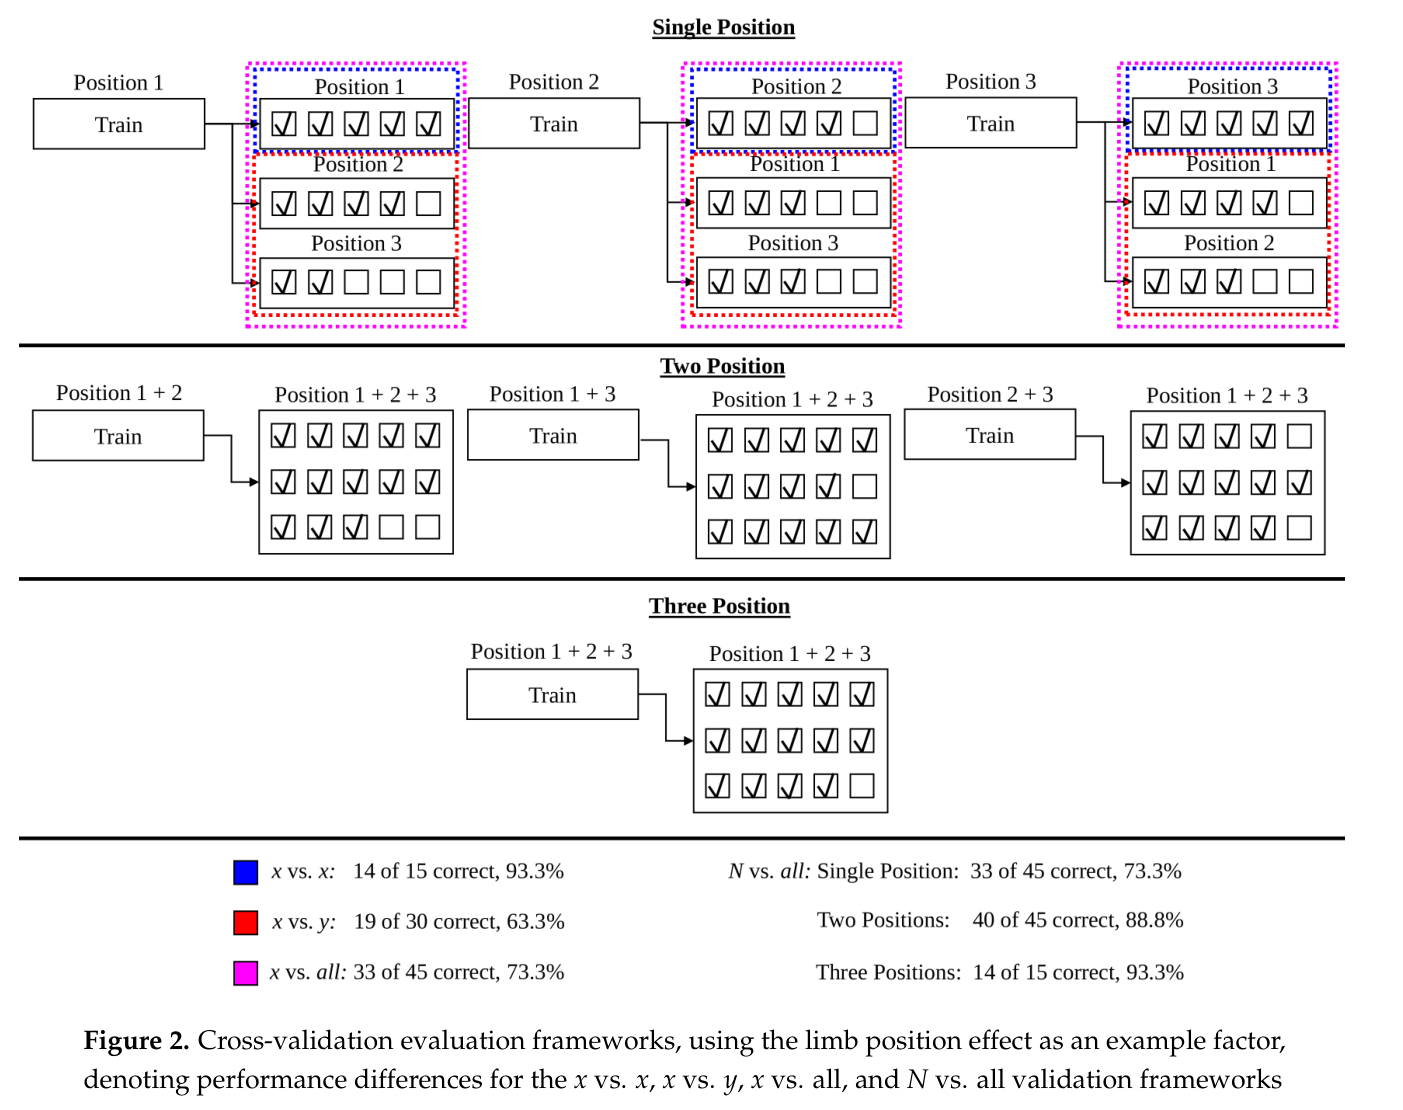
Read the coloured regions as different choices about which conditions enter training and testing. The important contrast is between matching a known condition and covering several conditions.
The percentages in this schematic are illustrative calculations, not experimental results. Actual position and intensity results are reported in Tables 5 and 6 and the subsequent training-coverage analyses.
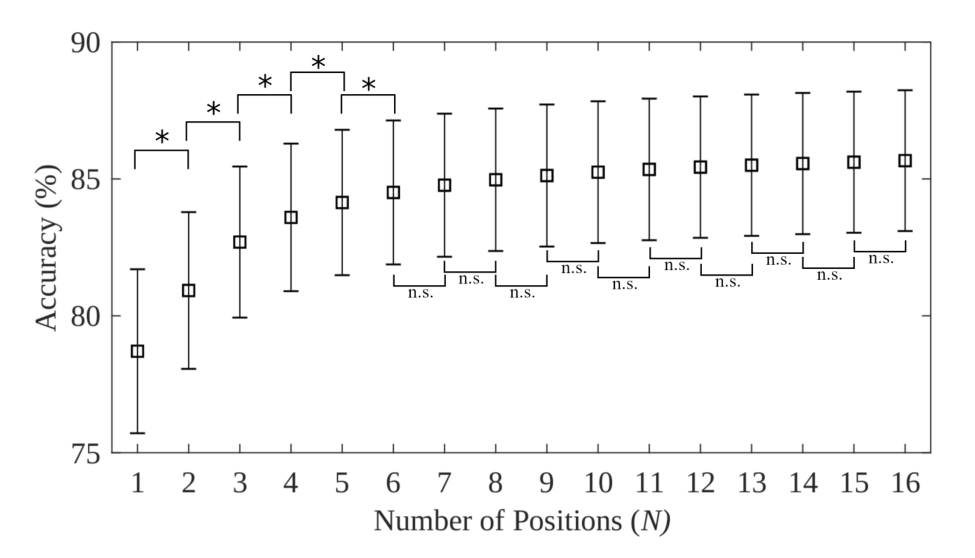
The limb-position analysis makes training coverage visible. Each point tests on all positions after training on N positions. Early additions improve the mean more than later additions, and the significance annotations distinguish supported pairwise changes from the apparent flattening of the curve. This is the 16-position dataset, not a pooled result across all reviewed studies.
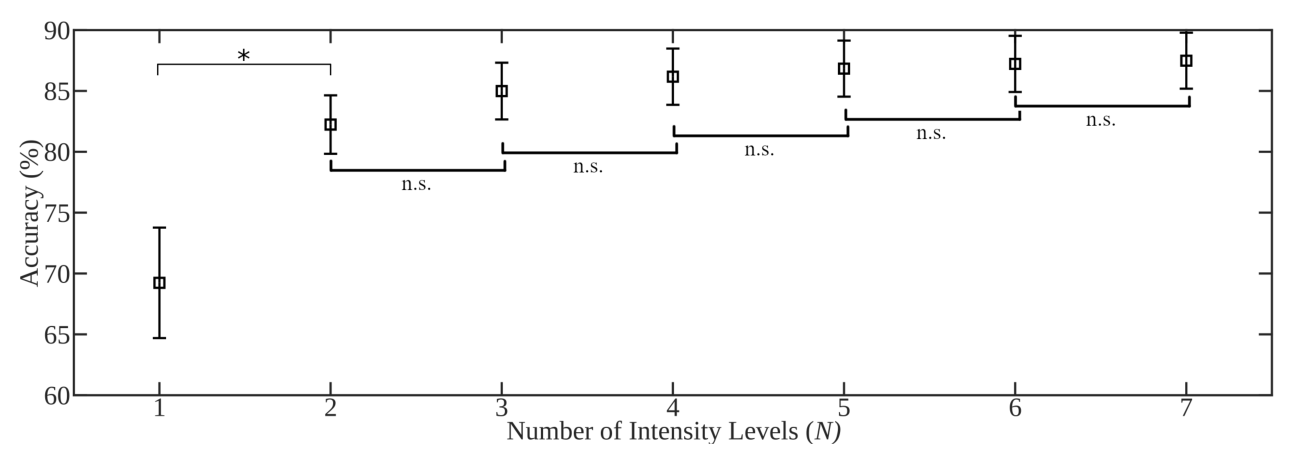
Contraction intensity has its own coverage experiment. The horizontal axis counts training intensity levels while testing spans all seven. Keep this curve separate from the position curve: they describe different datasets and factors. The early increase supports including intensity variation in this protocol without defining a universal number of calibration levels.
What the results do not establish
The recordings mostly isolate static conditions. Training across several fixed positions does not establish robustness throughout arbitrary three-dimensional movement, and a few sustained effort levels do not capture every changing contraction.
All six datasets concern participants with intact limbs. Their results do not establish the same training requirements for residual limbs. Nor does the comparison establish that LDA, or any feature set, is universally best outside these protocols.
Looking back
A retrospective reading should keep the emphasis on measuring the two factors separately and then testing how training coverage addresses them. The practical contribution is a more explicit relationship between acquisition conditions and the recognition result being claimed.
A focused next experiment would test whether the recommended static coverage transfers to continuous arm movement and changing effort, using the same participants and hardware. That would directly examine the boundary between the conditions measured here and the conditions encountered during use.
Read further
Evan Campbell, Angkoon Phinyomark, and Erik Scheme. Current Trends and Confounding Factors in Myoelectric Control: Limb Position and Contraction Intensity. Sensors 20(6), 1613, March 13, 2020. DOI: 10.3390/s20061613.
Start with the dataset descriptions and validation frameworks, then Tables 5–6. The position and intensity discussions explain the basis and limits of the training recommendations.