A feature can keep its name and change its role. A measurement that complements another feature in one population may largely repeat it in another.
That possibility matters when a prosthesis controller is developed using people with intact limbs and later used by people with limb loss. In this paper, we looked beyond a difference in classification accuracy to ask whether the relationships among electromyography (EMG) features also change across those populations.
The question
A myoelectric classifier turns measurements of muscle activity into estimates of intended movement. Before classification, feature extraction summarizes each short recording: how large the signal is, how quickly it changes, or how well a mathematical model describes its recent history. Several useful summaries are usually combined into one feature vector.
The usual design question is which combination best separates gestures. Here, we asked an earlier question: do those summaries describe the same kinds of variation in recordings from people with and without limb loss? If two features become more redundant in the target population, a combination selected elsewhere may offer less additional information than expected.
This was a representation study. We did not deploy a new prosthesis or measure everyday task completion. The goal was to make a potential source of transfer failure visible, then examine whether selected classification results were consistent with it.
The study at a glance
- Participants
- Two previously collected datasets: 20 participants with intact limbs and nine participants with transradial limb loss.
- Recordings
- Four EMG channels and eight motions in the intact-limbed dataset; eight channels and six motions in the limb-loss dataset.
- Representation
- 58 extraction methods produced 81 feature values. Both datasets used 250 ms analysis windows with 125 ms overlap after common preprocessing.
- Analysis
- Mapper visualizations of feature relationships, followed by linear support vector machine classification with ten-fold cross-validation.
These were different recording studies, rather than a matched experiment in which only limb status varied. That distinction belongs beside the participant counts: matching the later processing cannot erase differences in electrode arrangement, gesture sets, or collection conditions.
How we approached it
We first applied the same preprocessing to both collections, including resampling to 1,000 Hz. We then computed the features and standardized their values. Standardization reduced the influence of differences in numerical scale, so a feature would not dominate the analysis simply because its units produced larger numbers.
Next came Mapper, a method for simplifying a high-dimensional collection into a network. The objects being compared were features. Each feature was represented by its values across many recording windows; features with similar patterns of variation could then appear together in the network.
The resulting groups were interpreted in terms of signal properties: amplitude and power, nonlinear complexity and frequency, time-series modelling, and more distinctive information. We compared group membership across datasets, then tested selected features with a linear support vector machine (SVM). A feature was called migratory when its functional group changed between the two networks.
Technical detail: what Mapper is simplifying
For each dataset, principal component analysis retained 95% of the variance in the feature representations. The Mapper filter used distance to the second-nearest neighbour. Its cover used three regions with 50% overlap, and Ward’s hierarchical clustering identified local groups.
A network node contains features grouped within a cover region. Connections arise through shared feature membership between overlapping regions. These are relationships in a constructed representation, rather than physical connections between muscles or direct estimates of causal information flow.
The analysis therefore depends on the representation, scaling, distance, cover, and clustering choices. Source: Methods, Sections II-B and II-C.
What we found
Amplitude and power features stayed in the same broad functional group across the two datasets. Other features changed their neighbours. Maximal fractal length, myopulse percentage rate, and Willison amplitude moved from the complexity/frequency group into the amplitude/power group in the limb-loss data. Several autoregressive and correlation coefficients also changed groups.
We interpreted these migrations as changes in the information captured by the features. In particular, features intended to supply different views of the signal could become more alike. The paper describes losses of complexity/frequency and time-series modelling information, together with a reorganization of the unique-feature group. Here, ‘loss’ refers to that feature-space interpretation; the experiment did not measure the disappearance of a physiological signal source.
| Feature | Intact-limbed dataset | Limb-loss dataset |
|---|---|---|
| Root mean square (RMS) | 85.00% | 84.86% |
| Zero crossings (ZC) | 78.16% | 65.29% |
| Autoregressive coefficients (AR) | 79.85% | 84.84% |
| AR + ZC | 86.11% | 86.17% |
Linear SVM results with ten-fold cross-validation. The datasets have different numbers of channels and motion classes, so the columns are not a controlled estimate of an amputation effect.
The AR-plus-ZC example illustrates the argument. The combination was associated with different functional groups in intact-limbed recordings, but both feature types occupied the complexity/frequency group in the limb-loss network. The combined accuracies were similar across datasets, despite the latter having more channels and fewer classes. That pattern motivated the redundancy explanation; it does not isolate redundancy as the only cause.
Reading the figures
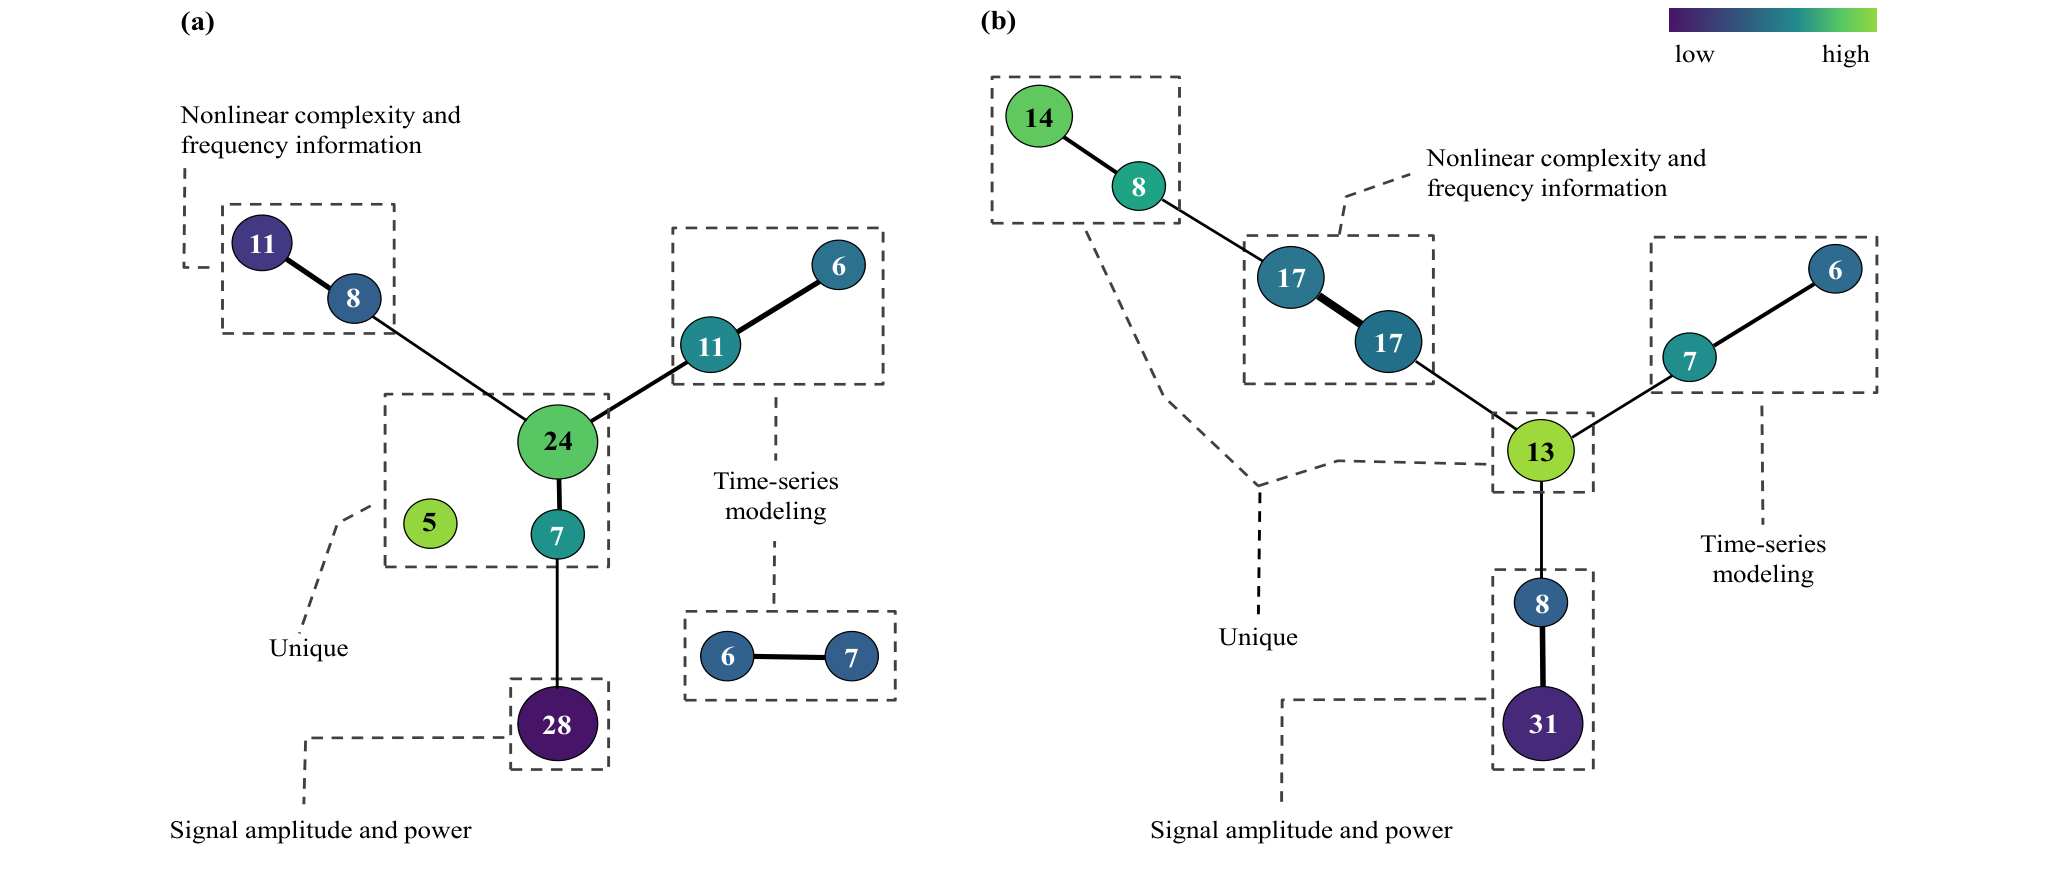
Read the figure by comparing group membership, rather than by comparing the exact position of a circle on the page. The left network represents the intact-limbed dataset and the right represents the limb-loss dataset. Circle size and the printed number indicate how many features are in a node. Colour represents the average filter value, with blue corresponding to smaller neighbour distances and green to larger ones.
The dashed regions organize the nodes into functional groups. Their labels supply the interpretation; the network itself was produced from relationships among feature values. A feature can belong to overlapping nodes, so adding the printed counts is not a way to recover the number of distinct features. The useful comparison is whether features that were neighbours in one population remain neighbours in the other.
What the results do not establish
The clearest limitation is the use of separate datasets. Electrode count and placement, available gestures, participant characteristics, and acquisition procedures differ. Common filtering and resampling address part of that mismatch, but cannot identify which remaining differences arise from physiology and which arise from measurement.
Nine participants with limb loss also cannot represent the full range of residual-limb anatomy, surgical outcomes, or prosthesis experience. The paper discusses possible contributors such as scar tissue and altered feedback, but does not experimentally connect an individual feature migration to any one of them.
Finally, ten-fold classification accuracy is not a demonstrated cross-user deployment result. The study does not report a participant-disjoint transfer benchmark for a controller trained only on intact-limbed data. Its evidence is about relationships within these datasets and selected classification comparisons.
Looking back
A retrospective reading of this paper makes feature complementarity a transfer question. It is easy to preserve a feature extractor in code and assume its meaning is preserved too. The networks show why checking the relationships among features may be useful when the population or recording setup changes.
A focused follow-up would collect matched gestures with matched hardware across the populations, assess the stability of the networks under resampling, and compare feature sets using participant-disjoint evaluation. That would help distinguish persistent population differences from the particulars of the two original datasets. These are proposed next experiments, rather than results from this paper.
The original discussion also proposed coordinated, multi-site data collection. Its enduring attraction is practical: a more representative target-population dataset can support both better models and more credible tests of whether a model transfers.
Read further
Campbell, E., Phinyomark, A., Al-Timemy, A. H., Khushaba, R. N., Petri, G., and Scheme, E. (2019). Differences in EMG Feature Space between Able-Bodied and Amputee Subjects for Myoelectric Control. NER, pp. 33–36. DOI: 10.1109/NER.2019.8717161.
Open the publication on IEEE Xplore or read the public copy hosted by the ISI Foundation. Start with Figure 1 and Table I, then read Sections II and IV for the construction and its limitations.