Inspect EMG in time and frequency, then use controlled motion-like drift and power-line interference to understand what bandpass and notch filters remove.
Download the complete runnable series (Python scripts, shared helpers and setup instructions).
Use 64-bit Python 3.11 and LibEMG 2.0.3. Keep the downloaded files together: the walkthrough uses common.py from that bundle. The figures below were generated by these scripts; results describe the stated recordings and split.
Choose a signal whose bandwidth supports the exercise
We switch to Participant1 of the public 3DC dataset: ten EMG channels at 1,000 Hz. A 20–450 Hz bandpass is meaningful below its 500 Hz Nyquist frequency. It would be invalid for the 200 Hz Myo recording, whose Nyquist frequency is only 100 Hz. The stored signal already reflects the device’s analogue filtering; software cannot recover frequencies removed by acquisition or reverse aliasing.
python prepare_data.py 3dcA useful observation model is \(y(t)=s(t)+m(t)+p(t)+\epsilon(t)\): physiological signal, movement-related contamination, periodic interference and other noise. These terms are not generally separable by frequency. Cable or electrode movement often adds low-frequency drift and transients; some contamination overlaps useful EMG. Securing electrodes and leads can address causes that a digital filter cannot.
Make the interference known without calling the recording clean
import json
import numpy as np
import matplotlib.pyplot as plt
from scipy.signal import welch, freqz
from libemg.filtering import Filter
from common import load_3dc_example, OUT, savefig

fs = 1000
recorded = load_3dc_example()  # Participant1/train, power grip, repetition 0
t = np.arange(len(recorded)) / fs
scale = np.std(recorded, axis=0)
drift = 2 * np.sin(2 * np.pi * 3 * t)[:, None] * scale
line = .8 * np.sin(2 * np.pi * 60 * t)[:, None] * scale
contaminated = recorded + drift + line  # added components are known
The power-grip recording is our reference, not a noise-free physiological ground truth. We add a 3 Hz sinusoid as a controlled low-frequency disturbance and a 60 Hz sinusoid as controlled mains-like interference. Their amplitudes scale with each channel’s standard deviation. This lets us inspect removal of known additions without asserting that all remaining signal is muscle activity.
Apply bandpass and notch filters separately
band = Filter(fs)
band.install_filters({'name': 'bandpass', 'cutoff': [20, 450], 'order': 4})
notch = Filter(fs)
notch.install_filters({'name': 'notch', 'cutoff': 60, 'bandwidth': 3})
band_only = band.filter(contaminated)
cleaned = notch.filter(band_only)
assert cleaned.shape == recorded.shape
A linear filter applies \(y[n]=\sum_i b_i x[n-i]-\sum_{j=1}^{M}a_j y[n-j]\), with coefficients chosen to shape its frequency response. The high-pass side attenuates slow drift; the low-pass side limits high-frequency components. A narrow notch targets the injected line frequency. Its approximate quality factor is \(Q=f_0/B=60/3=20\). A narrower notch preserves more adjacent bandwidth but tolerates less frequency drift.
Choose 50 or 60 Hz from the recording environment and measured spectrum, and inspect harmonics before adding further notches. Every notch also suppresses EMG at those frequencies. A visibly smoother trace is not, by itself, evidence of better gesture information.
In LibEMG 2.0.3, filtering a NumPy array returns the filtered array; filtering an OfflineDataHandler modifies its recordings and returns None. The offline path uses forward–backward filtering. Filter each complete recording before windowing, keeping different recording sets separate. Short windows repeatedly introduce boundary transients.
Use the spectrum to explain the time-domain change
f, p_recorded = welch(recorded[:, 0], fs=fs, nperseg=1024)
_, p_added = welch(contaminated[:, 0], fs=fs, nperseg=1024)
_, p_band = welch(band_only[:, 0], fs=fs, nperseg=1024)
_, p_clean = welch(cleaned[:, 0], fs=fs, nperseg=1024)
# An amplitude envelope is a different output, not a cleaned raw waveform.
envelope_filter = Filter(fs)
envelope_filter.install_filters({'name': 'lowpass', 'cutoff': 5, 'order': 2})
envelope = envelope_filter.filter(np.abs(cleaned))
Welch’s estimator averages periodograms of overlapping, tapered segments: \(\widehat P(f)\propto L^{-1}\sum_{\ell=1}^{L}|\sum_n w[n]x_\ell[n]e^{-j2\pi fn/f_s}|^2\). Averaging reduces variability; segment duration limits frequency resolution. At 1 kHz, 1,024-sample segments span about one second. PSD is power per hertz, not waveform amplitude.
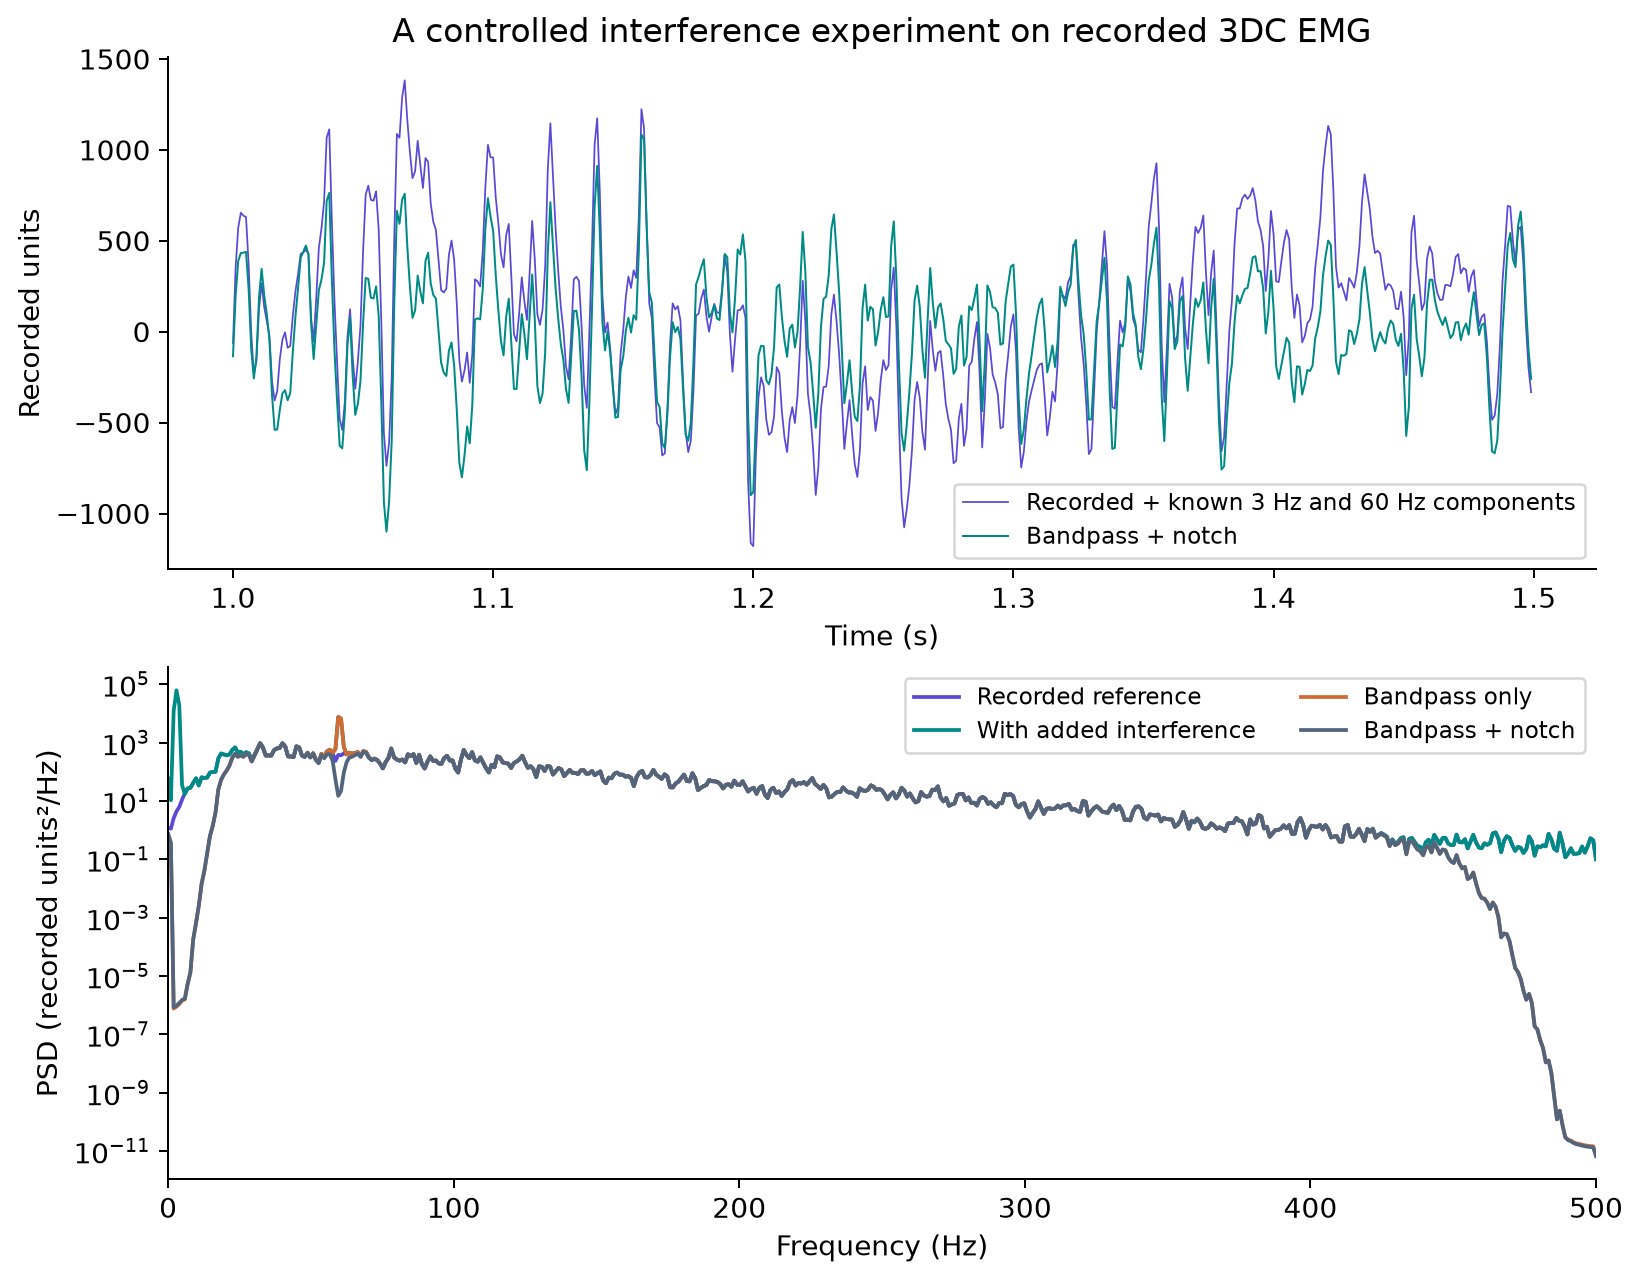
Read the spectral curves near 3 Hz and 60 Hz, then inspect the intervening band. Broadband EMG should not resemble a single stationary sine wave. Its spectral shape depends on the person, contraction, electrode geometry and hardware; one example cannot define a universal “correct” spectrum.
Distinguish zero-phase filtering from amplitude tracking
Forward–backward filtering cancels phase delay in the interior, but its magnitude response becomes \(|H(f)|^2\). It uses future samples and changes the effective filter order. A causal streaming implementation will therefore have a different response and latency. Inspect boundaries and verify the response actually applied, not just the nominal one-pass design.
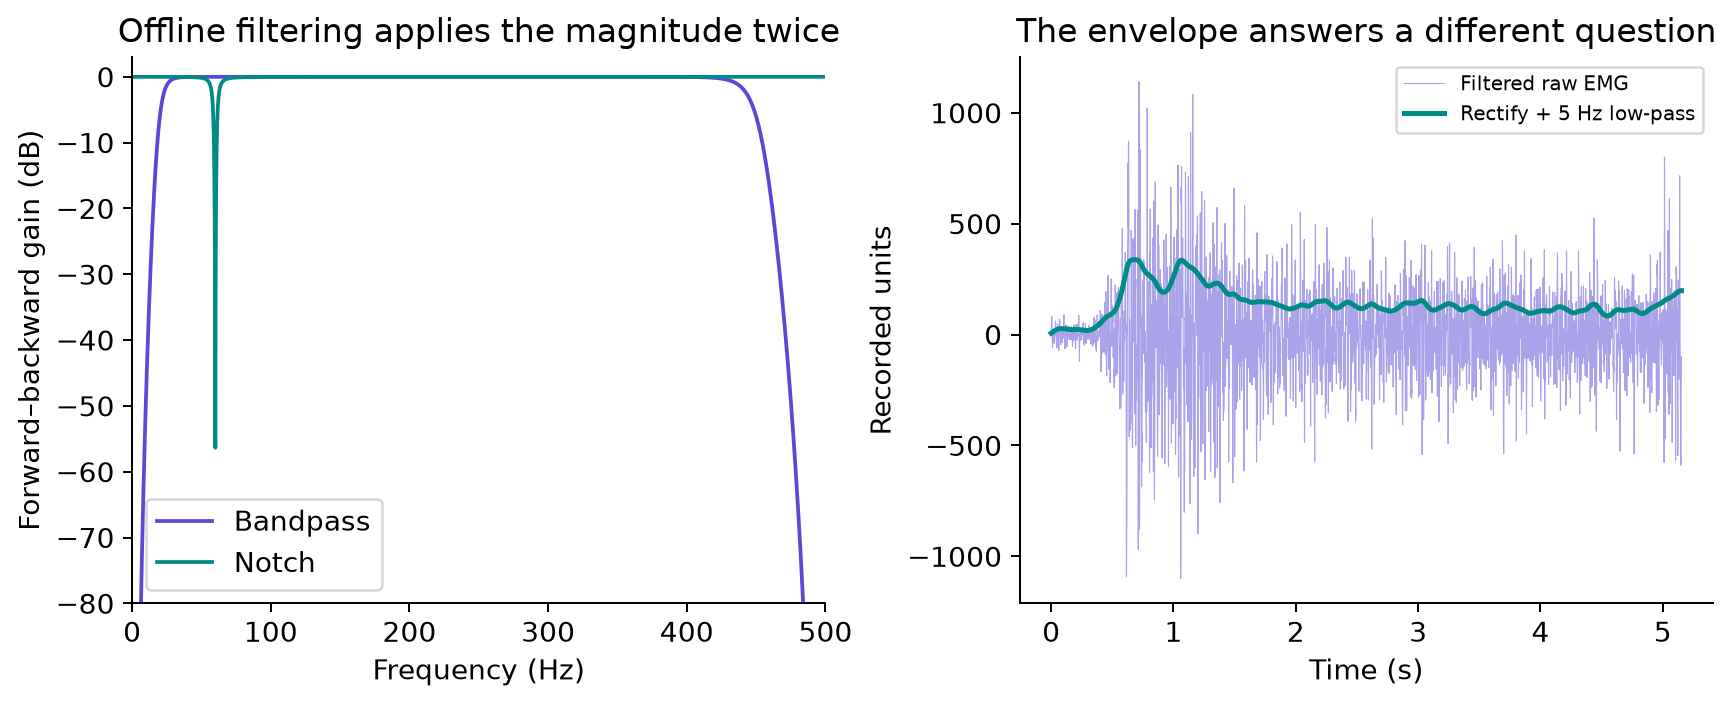
The envelope is approximately \(a[n]=\mathrm{LPF}(|y[n]|)\). It summarizes activity over time and discards polarity and much of the fast temporal structure. It can be useful for proportional control or onset analysis, but it is not interchangeable with raw EMG when extracting spectral features.
Try it yourself
Repeat with a 50 Hz addition and a deliberately mistuned 60 Hz notch. Explain the residual peak. Then increase the high-pass cutoff and identify both the removed interference and the useful band you sacrifice. Keep the original reference visible in every comparison.
Run the full companion script to regenerate the figures and machine-readable results:
python 02_filtering.pyLibEMG documentation: filtering